Products
One-Pager
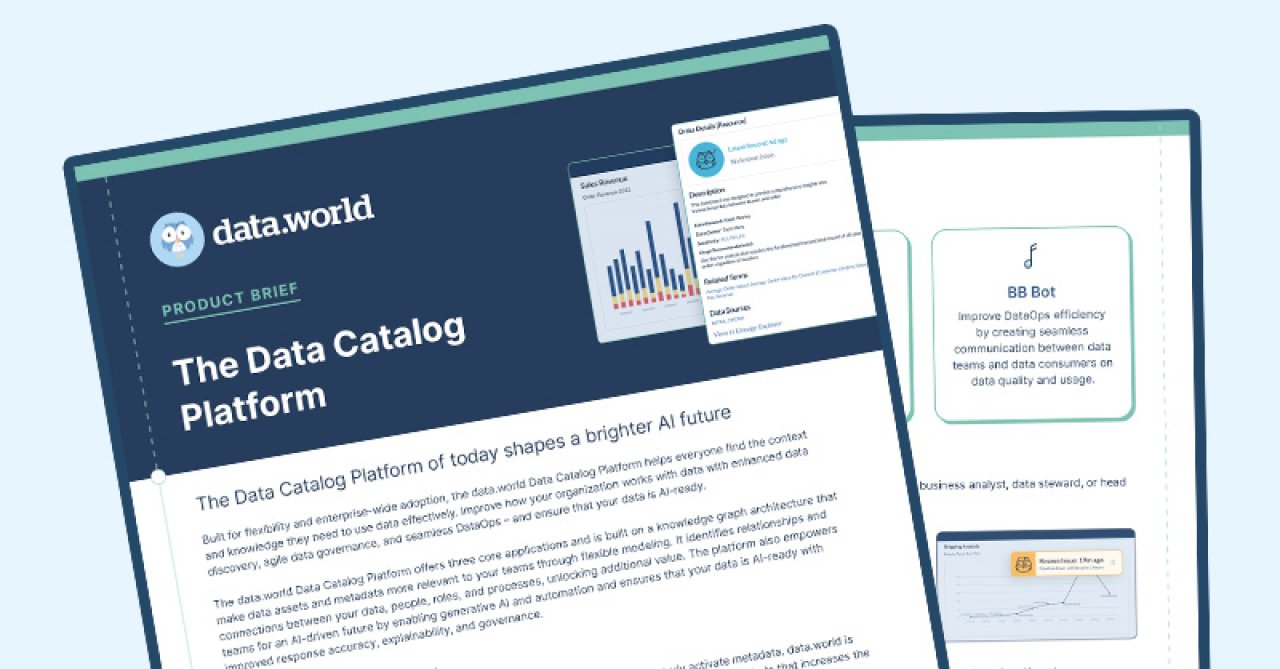
Unlock an Al-driven future with data.world's Data Catalog Platform. Enhance data discovery, data governance, and DataOps with a flexible, intuitive platform built for enterprise-wide adoption.
Download the one-pager
One-Pager
Unlock an Al-driven future with data.world's Data Catalog Platform. Enhance data discovery, data governance, and DataOps with a flexible, intuitive platform built for enterprise-wide adoption.
Download the one-pager
Industries we transform
Industries we transform
Roles we empower
Roles we empower
Documentation
Documentation
Common Integrations
Common Integrations
Knowledge hub
Knowledge hub
UPCOMING WEBINAR
.png)
Join us to discover how to build a powerful business case for data cataloguing and ensure successful implementation through the unified capabilities of BI:PROCSI and data.world.
View all webinars
UPCOMING WEBINAR
Join us to discover how to build a powerful business case for data cataloguing and ensure successful implementation through the unified capabilities of BI:PROCSI and data.world.
View all webinars
About us
About us
Connect
Connect

We are hiring!
Come join us in our mission to deliver data for all and data for good!
See all job openings
We are hiring!
Come join us in our mission to deliver data for all and data for good!
See all job openings
Products
One-Pager
Unlock an Al-driven future with data.world's Data Catalog Platform. Enhance data discovery, data governance, and DataOps with a flexible, intuitive platform built for enterprise-wide adoption.
Download the one-pager
One-Pager
Unlock an Al-driven future with data.world's Data Catalog Platform. Enhance data discovery, data governance, and DataOps with a flexible, intuitive platform built for enterprise-wide adoption.
Download the one-pager
Industries we transform
Industries we transform
Roles we empower
Roles we empower
Documentation
Documentation
Common Integrations
Common Integrations
Knowledge hub
Knowledge hub
UPCOMING WEBINAR
Join us to discover how to build a powerful business case for data cataloguing and ensure successful implementation through the unified capabilities of BI:PROCSI and data.world.
View all webinars
UPCOMING WEBINAR
Join us to discover how to build a powerful business case for data cataloguing and ensure successful implementation through the unified capabilities of BI:PROCSI and data.world.
View all webinars
About us
About us
Connect
Connect
We are hiring!
Come join us in our mission to deliver data for all and data for good!
See all job openings
We are hiring!
Come join us in our mission to deliver data for all and data for good!
See all job openings


 curl https://api.github.com/users/shad/repos
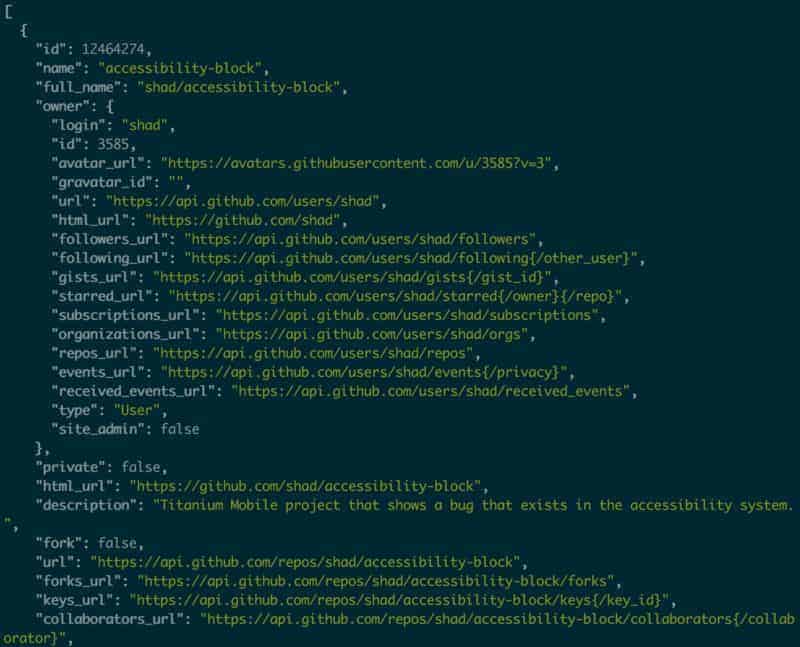 JSON
JSON Add JSON
 Explore to learn about files
 SQL queries against JSON